

Swiftech MCR320 3/8" NPT Radiator Review
Introduction
Welcome to my review of the Swiftech MCR320QP, this happens to be the very first radiator I owned, and I had been running two of these in my computer system for well over 1 year. This radiator would fit into the "slim triple" category, in that it's specifically designed with a single row of tubes, with 21mm of radiator fin and holds 3X 120mm fans on one side. This particular radiator is the older 3/8" NPT barb style and I ran the radiators with 5/8" x 3/8" NPT nylon barbs to minimize restriction. Since this version, Swiftech has updated the radiator by replacing the 3/8"NPT barb holes to G1/4 or 1/4"-19TPI BSPP threading which has become the standard. The newer version of the radiator according to Swiftech's charts is slightly more restrictive, but slightly more thermally efficient.
Before going into details, I'd like to give a special thanks to Gary from Sidewinder Computer Systems Inc. for sponsoring my latest computer upgrade, a quad core Q6600. After I complete a few more these radiator tests, I plan to switch over to CPU block testing on this new quad core processor. Sidewinder Computers is quickly becoming my favorite place to shop. Not only are they typically the lowest priced online retailer, they also ship extremely fast and have exceptional customer service. I would highly recommend you giving Sidewinder a visit on your next water cooling upgrade!

With this review I plan to cover radiator characteristics, hydraulic restriction, and thermal performance with a wide range of fans. I'll follow my typical engineering/technical flavor and keep the commentary to the point. In the end, I hope to provide you with some tools to help you design your water cooling system with this radiator. While I'll touch on some comparisons, the ultimate goal is to help you better understand how heat load and fan selection affects the performance of this radiator as well as hydraulic restriction.
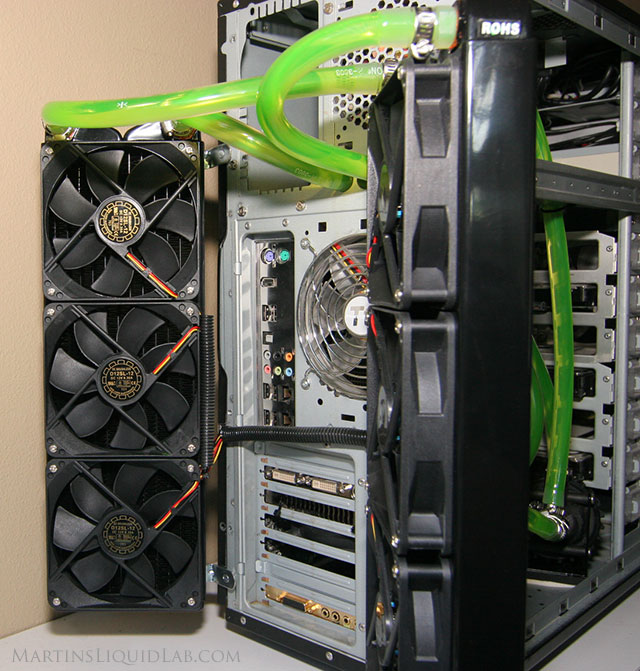
My very first water cooling loop running the MCR320's in series on a CPU/GPU multi block loop.
Radiator Characteristics
The radiator is a slim style, open finned radiator optimized for lower speed fans. Here are some characteristics I noted:- Single Row, Dual pass flow
- Top plenum chamber is specially shaped to minimize trapped air and self purge.
- 12 Brass Tubes and Chambers (One more tube and row than some radiators)
- Copper Louvered Fins (Standard louvers internally to increase turbulence)
- 3/8" NPT Threads (New version is G1/4")
- 410mm x 128mm x 34mm (L x W x H)
- I measure approximately 14.6 folds per inch, (Frontal length is 14" with 204 folds).
- Standard built in shroud of approximately 1/4" depth. - This is common to almost all radiators these days.
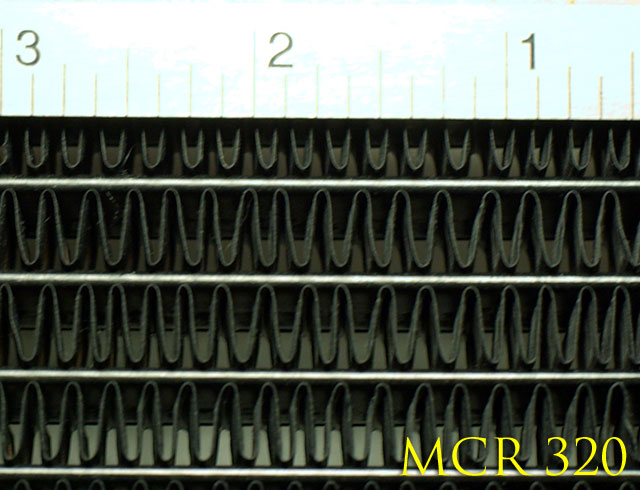
The fins are a good open density and the fins are fairly parallel to distribute air flow evenly
Hydraulics and Pressure Drop Testing
The most scientific way to determine a blocks hydraulic resistance is to test pressure drop. Pressure drop is a measurement of pressure loss across a radiator that varies with flow rate. This is basically a measurement of energy loss, and directly influences how much flow rate you will have.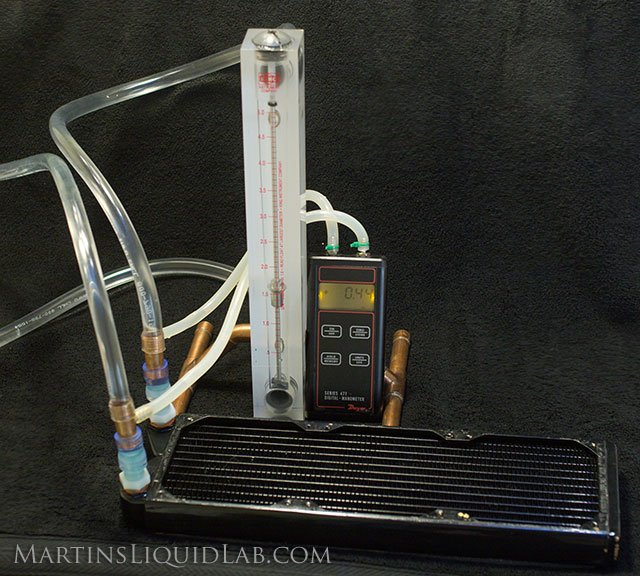
- Dwyer Digital Manometer 477 Mark V - Accuracy .5% of Full Scale. Range 0-20.00 PSI range, Resolution .01 PSI
- King Instruments 7520 Series 0-5GPM, 250mm scale - Accuracy 2% of Full Scale. Range 0-5GPM, Resolution .1 GPM (can be interpolated to .02GPM)
- Water Source - Household water pressure - 50PSI at >5GPM - Because flow rate readings are instantaneous, household tap water and water pressure are a good and powerful source for pressure drop testing.
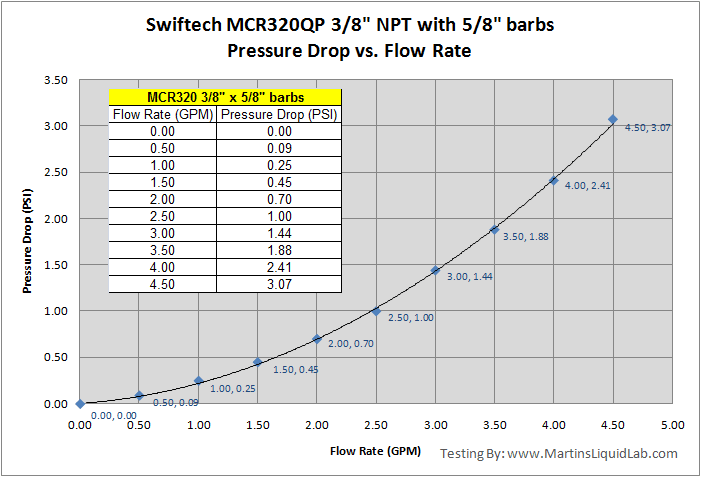
Pressure drop is very low with the 5/8" barbs.
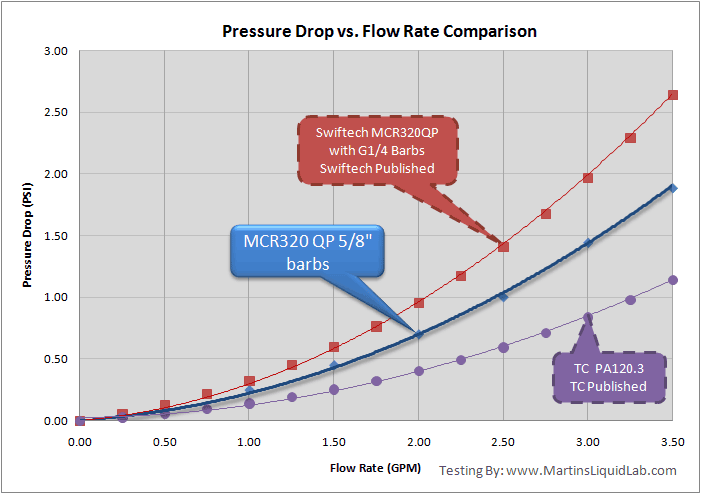
So the 5/8" barb trick does have some impact, it's a fair amount lower restriction than the newer G1/4 model, but not a low as the PA.
Thermal Testing Specifications
Welcome to my thermal testing of this radiator, but first I would like to give special thanks to Linus from NCIX.com for providing me with two sets of fans for testing. They provided me with both the Yate Loon D12SL12 slow speed 47cfm 120x25mm fans, as well as this Scythe Ultra Kaze DFS123812-3000 high speed 136cfm 120x38mm fans. Both fans present great value and a strong variety of cfm coverage for different setups.
I'm taking the "Scientific" approach to testing the radiator, and doing so by using and measuring an external heat source and apply two heat loads across 5 different fan scenarios. Using the two heat loads allows me to check my work, average out error, use higher heat loads than needed for measure larger differences, and finally allows me to use more accurate thermal sensors than those available in a processor. In the end I am then able to calculate a linear which produces a c/w ratio for each fan type. This is a very handy ratio for estimating, (c/w stands for degrees Celcius above ambient per watt of heat). Having the c/w ratio allows you to estimate the water temperature for any heat load....ahhh we have science and a TOOL!. Furthermore, because I'm testing over a large range of fan scenarios, I can then plot the fan RPM relative to the c/w values generated. While RPM from two fan types is not a direct performance relation (Pressure is equally as important), it surprisingly still creates a decent power trend-line curve. Regardless, the real advantage to do this RPM vs C/W chart is gaining perspective on how the radiator's performance changes over the use of different fan types. In general you will see as radiators are more dense and thicker, they will have a larger variance in performance from the lower speed/pressure fan types to higher speed fan types.
In addition to the "Scientific" approach, I'm also going a bit extreme on the sensors I'm deploying to measure all of this. Because this c/w ratio is a measurement of "Air" into the radiator, you have to seriously consider how much variability there is in air temperatures throughout a room and even across the radiator. Air is actually considered an insulator, so if you don't measure air at several locations and average them, the amount of error is higher than you would expect. Some of the measurements may only be a few degrees at lower heat loads, so it's almost a must to measure with higher accuracy thermometers, use several to measure several point, and log temperatures over a long period of time. With that, I've decided I would employ at least two digital sensors per 120mm section of radiator with a .2C mean error, and of course logging temperatures over at least 30minutes after an appropriate 30minute warm up period. All of this helps make up for the fact that I do not have an environmental chamber with controlled and consistent air temperatures.
With all of this, I'm able to get a pretty good and accurate understanding of how you can estimate performance depending on the fan used and generate some decent information. Below are some more details and links of the radiator testing equipment used:
Radiator Testing Specifications:
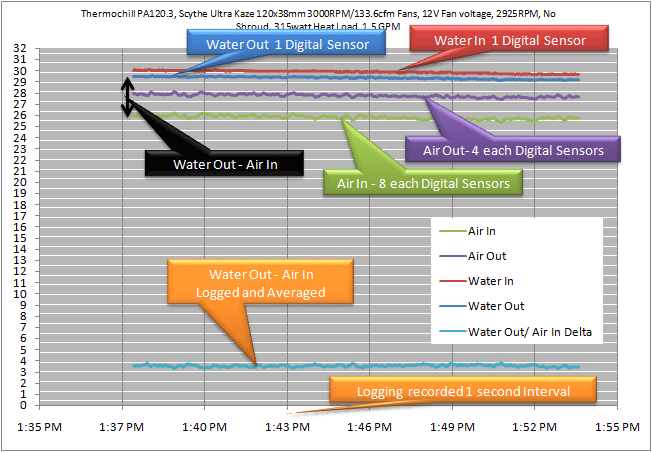
- Thermal Temperature and Fan RPM Monitoring - CrystalFontz CFA-633 32 Channels of temperature, 4 channels of fan RPM, Logging Capability in CSV format exportable to excel, .5C absolute accuracy. Used to log 14 individual temperature sensors and one fan RPM sensor to log results at 1 second intervals. Here is a small data example of what just one run looks like which is logged in the below chart, thankfully the Crystalfontz does most of the work for me.
- Thermal Sensors - Dallas DS18B20 Digital one-wire sensors. .5C absolute accuracy overall with a .2C mean error between 20-30C.
- Test Bench Sensors Deployed -
- 6 each air inlet sensors, two for each 120mm fan section (2 were not used)
- 4 each air outlet sensors, 1 for each 120mm fan section
- 1 water inlet sensor
- 1 water outlet sensor
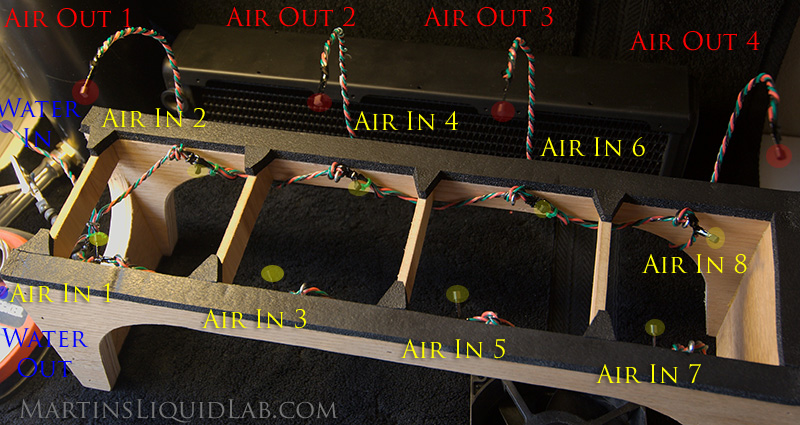
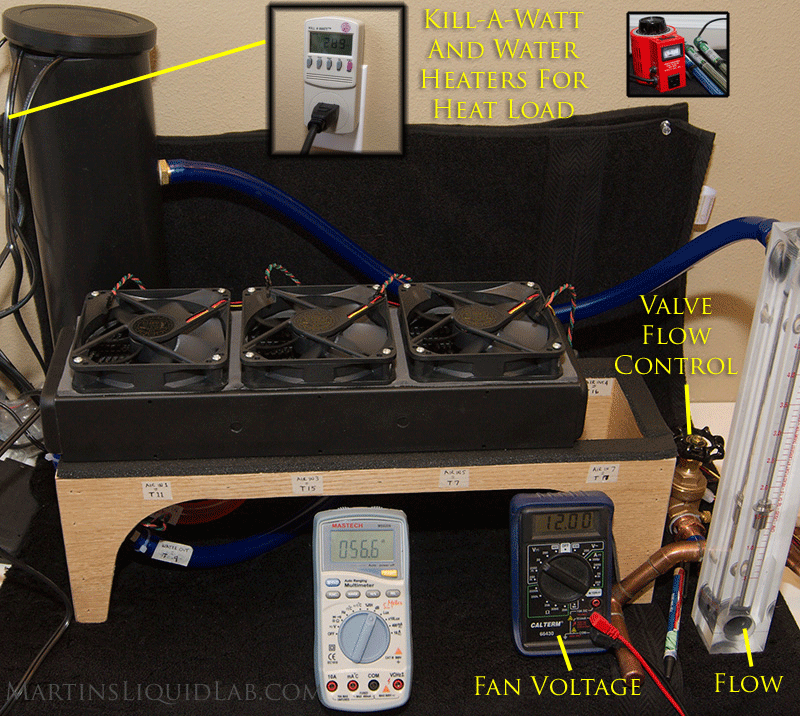
- Custom Test Bench - Custom built 120mm x 4 radiator test bench with permanently mounted sensors to improve consistency and minimize setup time.
- Flow rate - King Instruments 7520 Series 0-5GPM, 250mm scale - Accuracy 2% of Full Scale. Flow rate is controlled via 3/4" brass gate valve to precisely 1.5GPM. Flow rate effects are generally minimal in radiators so I have selected 1.5GPM as a good average flow rate point.
- Water - I used regular filtered tap water for testing purposes.
- Warm-up - Each fan configuration is allowed to reach temperature for 30 minutes prior to recording and logging of temperatures.
- Fans:
- Yate Loon D12SM12 120mm x 25mm - 70.5cfm/1350 RPM/33 db (open air)
-
- Ultra Slow Speed Fans - Undervolted to 1000 RPM
- Slow Speed Fans - Undervolted to 1350 RPM
- Medium Speed Fans - Voltage adjusted to 1550 RPM
- Scythe Ultra Kaze DFS123812-3000 - 136cfm/3000 RPM/45.9 db (open air)
-
- High Speed Fans - Undervolted to 2000 RPM
- Ultra High Speed Fans - Voltage adjusted to 2930 RPM
- Logging of Temperatures - Each temperature sensor and fan rpm channel is logged for 30 minutes to both average out any temperature fluctuations and also to ensure the system has stabilized and heat loads/fan RPMs remained constant during the testing period. If temperatures did not fluctuate or an error occurred, the test was thrown out. Over a 30 minute period data for all 14 temperature sensors and fan header are recorded every second producing a data matrix of 1,800 entries over each channel.
- Air Inlet Temperature Data - Each test averages the 8 inlet channels (6 in the case of a triple radiator), and then average over the testing period of 1,800 results. So Air In can be the average of up to 8 x 1800 = 14,400 data points collected.
- Water Outlet Temperature Data - Water outlet data is also captured by the same Dallas sensor with an average of 1,800 data points collected.
- Fan RPM - Also recorded and monitored with the Crystalfontz. Fan RPM is carefully adjusted using a Sunbean fan speed controller to be the following:
- 12V Full Speed - Each fan is first adjusted to 12.00V +- .05V for the full speed test runs
- RPM - Subsequent fan scenarios are voltage adjusted to match RPMs as specified with 10RPM.
- Open Environment Testing - I also wanted to note, that I am not insulating the coolant lines, my flow rate meter, or my reservoir, so the c/w values I generate are for the complete system. I am using about 6' of 1/2" ID by 3/4" tubing, a 14" King Instruments flow meter, a 3/4" brass gate valve, and at tall 4" diameter by 24" tall reservoir which do loose some heat during testing. Initially I had thought about insulating my system, but the more I've thought about it, a regular water cooling system also looses heat through tubing and reservoirs, so I think it's an acceptable heat loss that is similar to normal water cooling systems. I also have and will continue to test every radiator exactly the same, so they all have these same heat loss advantages through the test system. The one variable I can't fix is the ambient temperature changes, and there is some differences in thermal properties of air as it changes. I think they are probably small enough to keep my results within 5% or so, but it's still something I don't have control over where an environmental chamber would be ideal.
Thermal Testing
So, after 10 individual 30minute warm ups and 30minutes sessions of logging temperatures across those sensors, these are my tabular results. This includes the average of the sensor types such as RPM, air in, air out, water in, water out, delta, and c/w.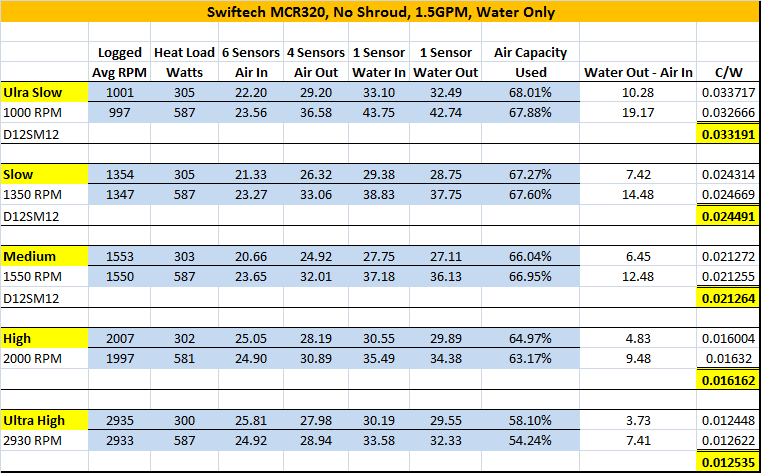
I've also added a column indicating the percentage of air capacity used. This just tells you how much the air temperature rises relative to the water, and you can see as the fan speed rises, the efficiency here starts to drop. You can also see that the 21mm thickness does a pretty good job and using up the air capacity particularly at the slower fan speed settings. The other reason I like this table is the air out measurements, you can see even with a rather substantial 300 watt heat load, with medium speed fans, the air out is only about 4 degrees warmer than the air in temperature. This is why it's fine mounting a radiator and blowing into a case, if you're moving enough air...it's not really hot at all coming out of the radiator.
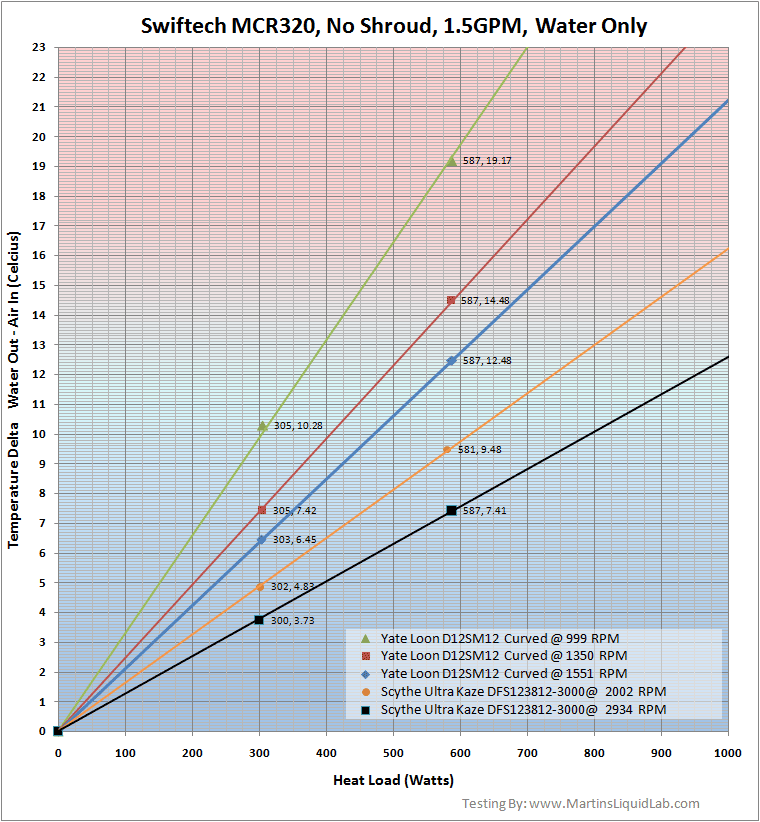
To estimate water temperature, take your heat load in watts and follow it up vertically to the fan scenario. When you cross that line, turn left and follow it horizontally until it impacts the vertical axis on the left. This temperature delta will be your number that you need. To estimate your water temperature simply add this number to the ambient.
- Extreme Outer Visions PSU calculator - Just note heat load minus the 38 watts included in the start.
- Swiftech's Conroe/Kentsfield CPU calculator - This is actual an estimator for the kit, but it also gives what I think is a more accurate heat load for the processor. Just plug in the field and it will output a heat load in watts.
So what does this water temperature mean? You are cooling with the water that leaves your radiator and enters your CPU block. So any improvement in this number will directly translate into an improvement in your CPU temperature. For example if your water temperature delta is 10C and your loaded core temperature was 50C. If you improved your water delta by 5C either by adding another radiator or increasing your fan performance, your new core temperature will be 45C assuming your ambient temperature remained the same.
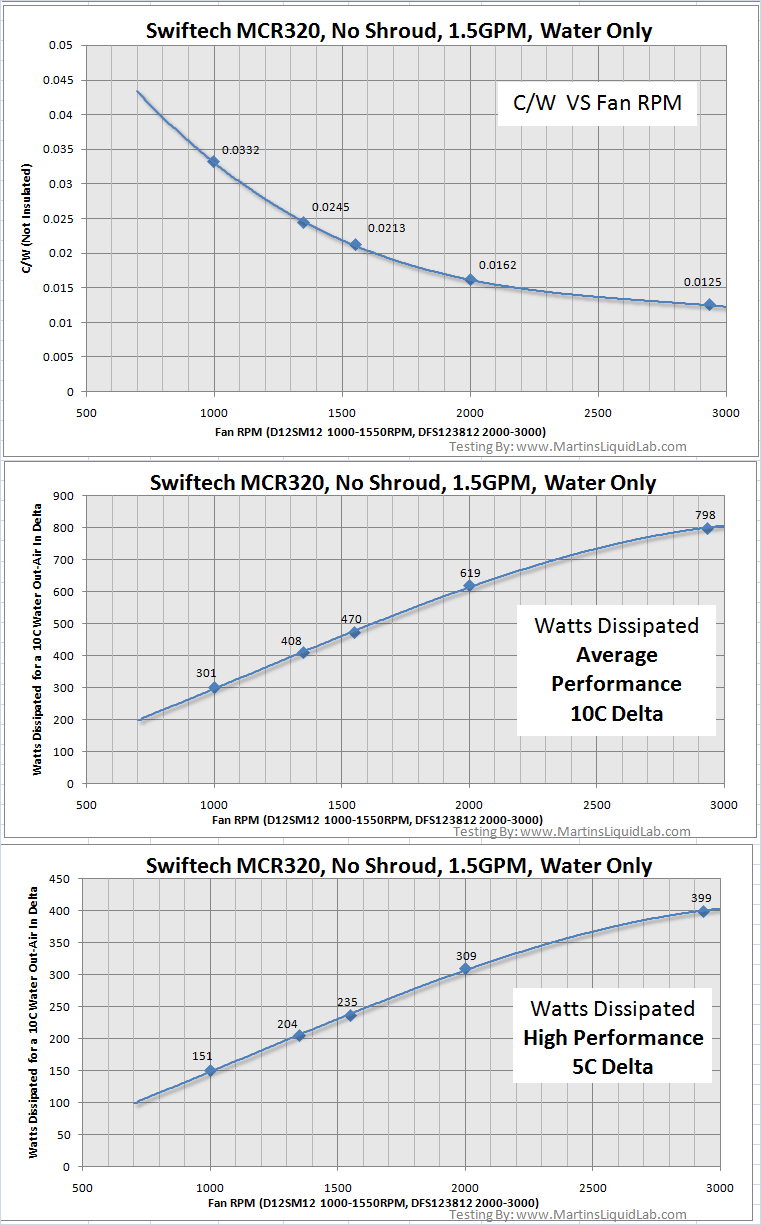
Now to take that and look at it another way, I've extracted the data and plotted c/w vs rpm, heat dissipated (10C) vs RPM, and heat dissipated (5C) vs RPM. If you want a high performance water cooling system I would recommend a 5C delta or lower. More than anything this just shows you the results do follow a trend and data appears to be reasonably consistent between points (reassuring to me that the testing doesn't have obvious errors in any one point). It also shows you that performance with the fan selection is fairly linear vs RPM until you get to the Ultra High speed fans where it starts dropping off fairly quickly.
How does it compare to other radiators
I currently don't have any other "slim triple" radiators results I can share with you and compare, but the MCR320 performs exceptionally well for the price point and size. It actually performs very well and not all that far behind my Thermochill PA120.3 results which is a highly regarded and proven well performing radiator.Here is a quick comparison to the PA120.3
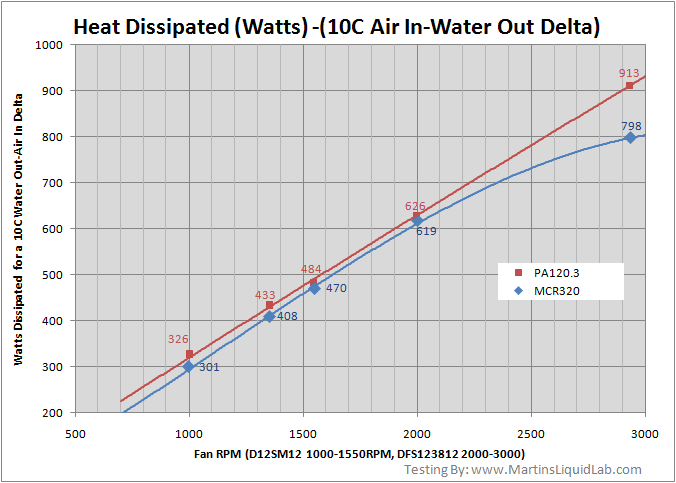
The double thickness PA120.3 is performing better across all fans, with it's greatest advantage with Ultra High Speed fans.
I have to question my results as I just don't like surprises without checking it and still learning about this type of testing. To do that I went back to Thermochill's site and looked a little more closely at their c/w curves at the bottom of their technical page. This testing was done by Bill Adams who I've followed in his work and respect and trust his results moreso than my own, he really is the king of testing and knowledge. What I found was the very bottom c/w graph just so happens to compare and contrast an MCR220 and a PA120.2 on the same curve. Granted that's a double to double comparison, but I would still expect their relative performance percentages to be similar or close. Using the Nexxus fans (which is essentially yate loons at 1000RPM) I could extract roughly the following values:
PA120.2, c/w = .0475, 10C delta = 211 watts
MCR220, c/w = .05, 10C delta = 200 watts
To calculate the 10C delta, you just need to follow units by taking the inverse and multiplying by the delta. For example if c/w =.05, then w/c = 1/.05 = 20 watts/celsius degree. For 10 degrees, that's 20 w/c * 10c = 200w.
While it's hard getting anything very accurate from reading a chart, assuming it's close enough for a rough check...that still calculates out to about a 6% difference, and I measured about an 8% difference with 1000RPM fans on the triple radiators. So overall, I'm content with my results meeting a reasonable check.
So.... with lower speed 1000 RPM fans, the PA120.3 will dissipate somewhere around 6-8% more heat than the MCR320, and that percentage raises up to about 14% as the fan performance increases and the extra thickness is better utilized. The MCR320 is really a great radiator for it's compact size and performs much better than I expected. I attribute this to two things, one is the larger frontal surface area than many standard triple radiators, this extra frontal area provides a great benefit. In addition the MCR320 (14.6FPI) has about 40% more fin density than the PA120.3(10.2FPI) per my counting across the length of the radiator. I didn't notice this upon initial inspection, but this prompted me to count fins across the entire length of the radiator. So while the PA has the additional surface area with double the thickness, the MCR makes up for some of that with more surface area in the first 21mm thickness.
And to take this information and apply some assumed heat loads, it would look something like this:
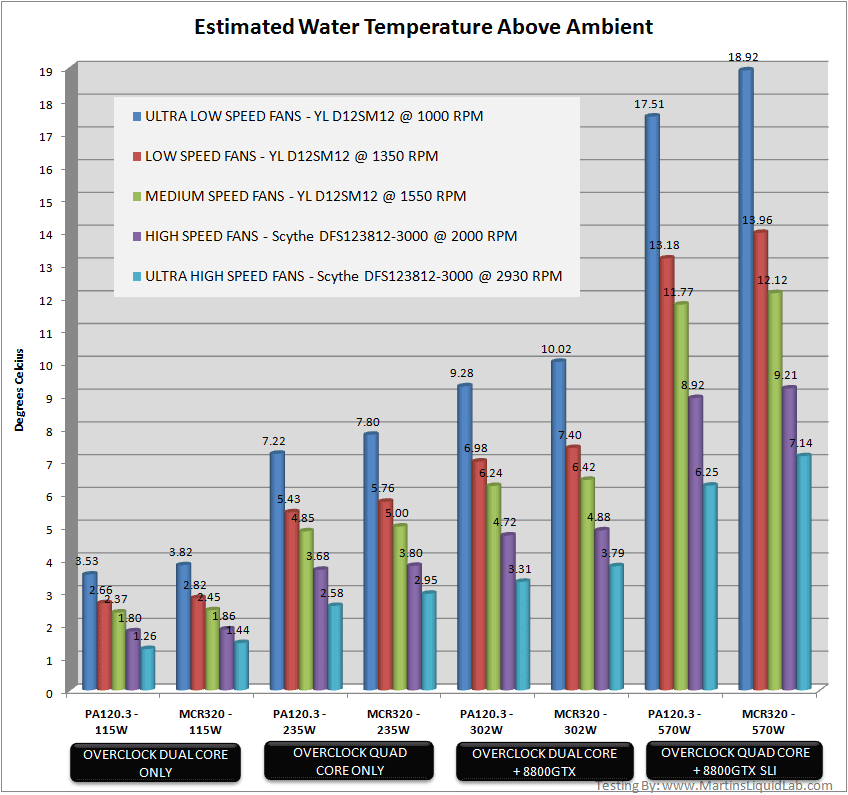
The PA120.3 is obviously better across all fans, but the little MCR does a fine job for it's thinner and smaller size.
- 115W heat load - Any fan will do the trick, even the ultra low speed fans
- 235W heat load - Medium speed or 1550RPM fans will keep heat under 5C
- 302W heat load - High Speed or 2000RPM fans will do it
- 570W heat load - A bit too much, even the 3000RPM Ultra Kazes can only manage a 7C delta. At this point I would recommend either two radiators, or a bigger radiator. Not to say that a 10C delta is bad, but I prefer seeing a 5C delta or better.
MCR320 Estimator Spreadsheet
If you want to tinker with heat loads and fan results, rather than using the charts, I've created this quick little spreadsheet where you can enter in your own heat load and ambient temperature. It will then show you the estimated water temperatures based on the results I gathered above.Note this is for informational and educational purposes only.
SwiftechMCR320Estimator.zip
97-2003 Microsoft Excel (.xls) format
Price Considerations
If you're in the market for triple radiator, I found the following options at Sidewinder to compare:Prices as of 6-28-08
Swiftech MCR320QP - $47.95
HWlabs Black Ice Pro 360 - $42.95
HWlabs Black Ice Xtreme 360 - $62.95
Thermochill PA120.3 - $134.95
HWlabs Black Ice Xtreme GTX 360 - $109.95
So at $47.95, the MCR320 is one of the lower priced radiators and an excellent value!
Pros
- Outstanding value, high performance/low cost!
- Optimized for Ultra low through High Speed fans
- Low restriction
- Plenum chamber shape bleeds quickly
- Thinner size will allow more flexibility in installation options
Cons
- Not as efficient as the high end model radiators, particularly ultra high speed fans.
- Black paint is easily chipped
- NPT barbs (old model tested) not compatible with G1/4 standard. Tapered threads require sealant.
Bottom Line
The MCR320 is really a good all around performer at a great price. It's fairly low in restriction so running more than one in the same loop is generally fine and it performs very well.Where to buy
Sidewinder Computer Systems MCR320 Direct Link