

Radiator Estimator Spreadsheets
This page is dedicated to providing updates and development of my radiator estimator spreadsheets.
What is it? How does it work?
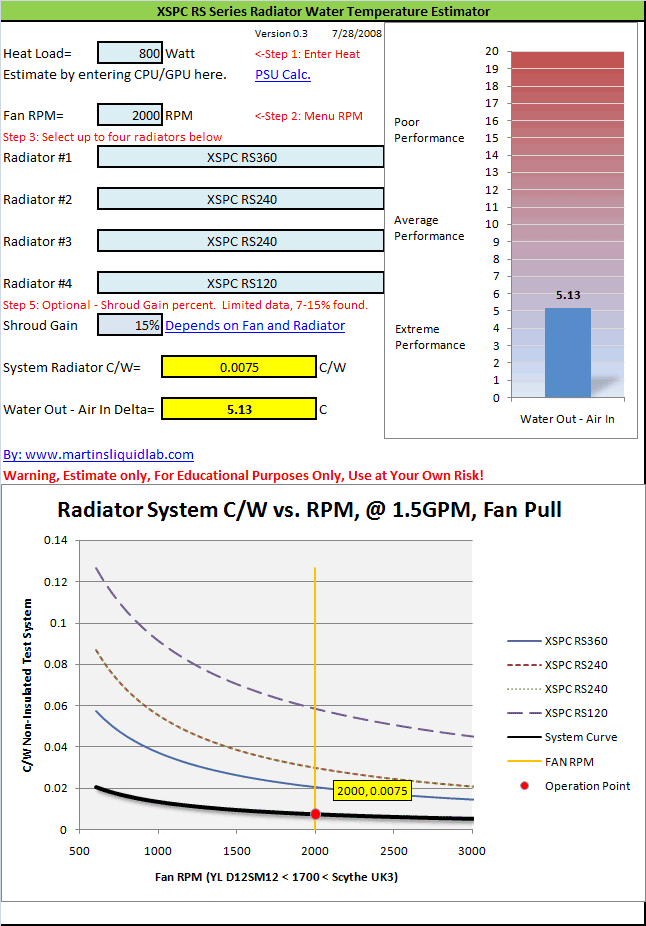
It is an educational excel file that will help you understand the importance of heat and fan performance relative to radiator sizing. As I get more radiators tested, I'll update these sheets to further help you in selecting the appropriate size radiator. It's a common misconception that a radiator has a "Capacity" and that performance is good up to that capacity as if you have a fuel tank of gas you can expend. Unfortunately to define any sort of capacity, you have to select a temperature delta. It's common to think of heat dissipated according to a 10C delta, but it's not always used 5C or 15C are also used for those numbers. To make matter even more complicated the performance of the radiator is highly dependant on the fans selected, it's not uncommon to see 3-5X the radiator performance difference simply by using different fans. This pretty much makes trying to understand what size radiator to use extremely difficult, and why I've developed these helps.The delta I previously mentioned is more specifically the Water Out (water coming out of the radiator) temperature - the (Air In) temperature. This is an independant, but very good measure of how your radiator and fan combination is handling the heat. There is also no set in stone number for what is required, I would simply suggest that an "Extreme Performance" level system would seek to attain 5C or less, and an "Average Performance" level system would seek 10C or less. I havn't pinpointed when a system meets air cooling standards, but I would expect a 15C delta and have assumed that to be "Poor Performance". In the end, this number simply can be used to estimate your water temperature, and gains or reductions in water temperature will correlate to the same amount of gain in processor temperature. For example if you have a 10C water delta and your processor temperature is 55C under load. If you make changes to your radiator or fan setup to get down to a 5C delta, your new processor temperature would be 50C (assuming your ambient was constant).
The spreadsheet works by using the data I've collected in my radiator testing and using that data to plot a C/W vs RPM power curve equation trendline. It's not perfect because I do use two different fans, but it gives you one curve to pull data from. It then uses the combination of the entered heat load and RPM to produce a Water Out - Air In delta number. In addition, I've added a shroud performance pull down where you can bump performance for the added use of shrouds. I left this up to the user to decide because I don't belive there is enough data collected on shroud performance on different radiators to do any better with that. I know that I gained around 7% shroud gain using the TFC shroud in pull with 25mm fans 1350RPM and nearly 15% gain with the 38mm fans at 2000RPM. In addition I gained nearly 28% for using two fans in push pull with shrouds. I expect those results will vary depending on the radiator and fan combinations, but I'll leave that to you to decide.
Disclaimer
This is for educational purposes only! I would not recommend using these spreadsheets to compare radiators as there are far too many variables in radiators to know if performance is the same with your particular fan setup and pumping power. The curves included in these estimators are based around the Yate Loon D12SM12 (25mm) "Curved blade" fan for low speed fans, and the Scythe "Ultra Kaze" 3000 (38mm) for the 2000-3000RPM fans. These fans have shown to have decent static pressure, but any fan that varies from these fans will utimately perform a little differently per RPM depending on the particular radiator used and how much pressure that fan has. Generally 38mm fans will produce more pressure per RPM than a 25mm fan, etc.. but there is no hard and fast rule. But rather than have no tool, I would accept that using different fans may yield different results. In addition all of the radiators were based around a fix 1.5GPM flow rate. Flow rate differences are generally fairly small between radiators, but they do exist so there is likely to be some differences. If you are getting greater than 1.5GPM , you should be getting better performance, and less than 1.5GPM...less performance, etc. These are fairly new, so I have very little information on checking accuracy other than the data I collected to create the curves. With that said, I'm just going to assume, the accuracy of the results is no better than 30%.Download:
By clicking the link below you understand:- Educational spreadsheet for educational purposes only
- Curve database is built from a fixed 1.5GPM, two specific fans in pull, no shroud.
- Estimator is possibly in error by as much as 30% or more
- Author is not responsible for accuracy or error.
- Use this information at your own risk!
| Description | Download |
| Pontiac 1977 Bonneville Heatercore |
Martins-RadEstimator-BonnieHeatercore-03.zip |
| Hardware Labs 480GTX |
Martins-RadEstimator-HWLabs480GTX-03.zip |
| Thermochill PA120.3 |
Martins-RadEstimator-PA120_3-03.zip |
| The Feser Company TFC 480ER |
Martins-RadEstimator-TFC480-03.zip |
| XSPC XSPC RS 120 XSPC RS 240 XSPC RS360 |
Martins-RadEstimator-XSPC-RS-Series-03.zip |
SUPPORT FURTHER DEVELOPMENT! or say THANKS!
If you would like to show your appreciation for this work and contribute to further developement. Just click the link below to send me any amount through paypal. Thanks!!! Martin